Featured Infographics


Latest Infographics

Infographic
Explore the Evolution of Pesticide Analysis
This infographic guides you through the analytical journey from early detection limitations to cutting-edge screening technology, providing the insights needed to meet modern food safety and regulatory compliance demands.
Infographic
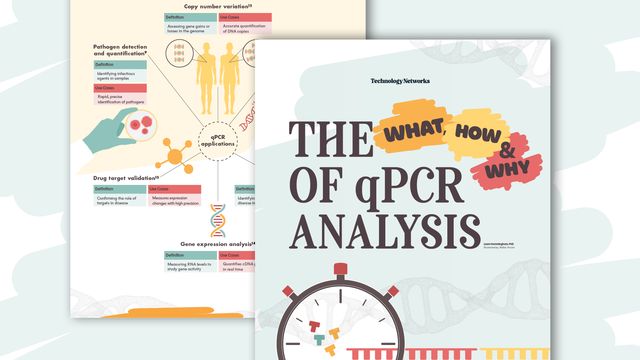
The What, How and Why of qPCR Analysis
This infographic highlights the principles, strengths and limitations of qPCR while showcasing its applications across fields including oncology, pathogen detection, gene expression, biomarker discovery and beyond.
Infographic
Oligonucleotide Purification Strategies To Enhance Performance and Versatility
This infographic highlights the high-performance purification techniques that are essential for high-quality oligo production.
Infographic
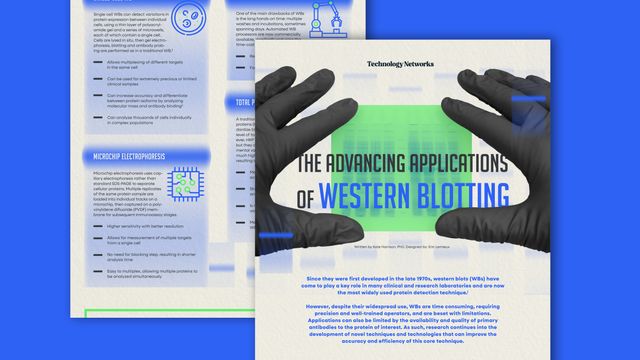
The Advancing Applications of Western Blotting
This infographic provides a comprehensive look at the evolving landscape of western blotting. It outlines diverse application areas and explores technological advances that are overcoming long-standing limitations.
Infographic
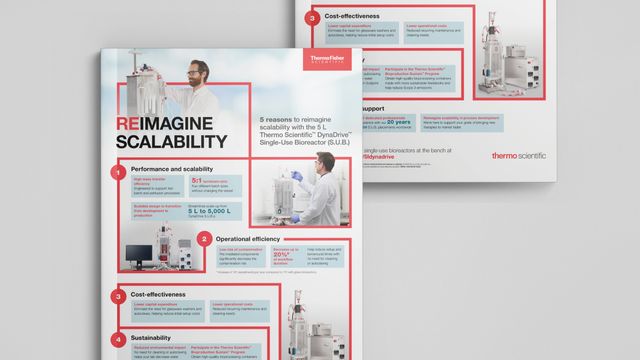
Rethink Scalability in Bioprocess Development
This infographic highlights how bench-scale single-use bioreactors help overcome these barriers with efficiency, flexibility and reduced environmental impact.
Infographic
Key Insights Shaping Biotech Today
This infographic highlights critical biotech trends and offers a snapshot of opportunities shaping the future of biologics and beyond.
Infographic
Flow Cytometry Staining Protocols for High-Quality Data
This infographic is your quick guide to troubleshooting staining protocols. Discover the high-performance products that when used with optimised staining protocols can shed light on your flow cytometry experiments.

Infographic
The Simple Path To Proteomics in Just Nine Steps
This infographic explores a workflow that can bring proteomics to any lab in nine easy steps. Discover how to run a proteomics workflow in a short timeframe, even without prior experience.
Infographic
Optimize Nanomedicine With Better Particle Insight
This infographic explores the most effective techniques for analyzing nanoparticle properties, offering guidance on selecting the right tools for measuring critical quality attributes and improving design precision.
Advertisement