Featured Infographics


Latest Infographics
Infographic
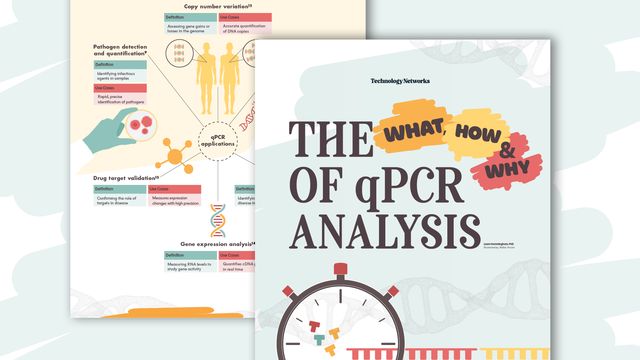
The What, How and Why of qPCR Analysis
This infographic highlights the principles, strengths and limitations of qPCR while showcasing its applications across fields including oncology, pathogen detection, gene expression, biomarker discovery and beyond.
Infographic
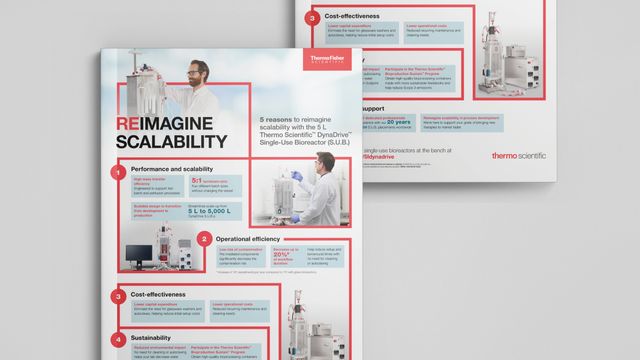
Rethink Scalability in Bioprocess Development
This infographic highlights how bench-scale single-use bioreactors help overcome these barriers with efficiency, flexibility and reduced environmental impact.
Infographic
Flow Cytometry Staining Protocols for High-Quality Data
This infographic is your quick guide to troubleshooting staining protocols. Discover the high-performance products that when used with optimised staining protocols can shed light on your flow cytometry experiments.
Infographic
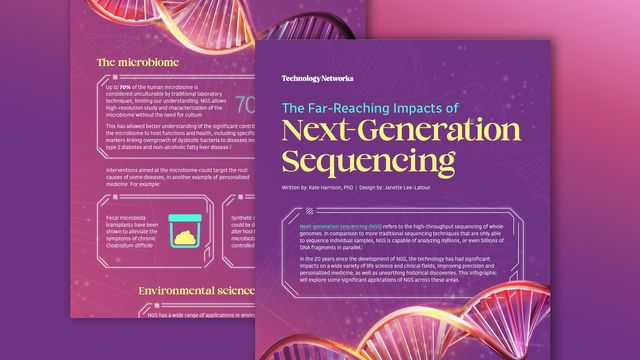
The Far-Reaching Impacts of Next-Generation Sequencing
This infographic will explore how NGS has contributed to advances in personalized cancer treatment, microbiome research and environmental sciences.
Infographic
Optimize Patient Outcomes With LC-MS in Therapeutic Drug Monitoring
This infographic explores how liquid chromatography–mass spectrometry (LC-MS) offers the precision, sensitivity and reliability needed to overcome these challenges in the clinical setting.
Infographic
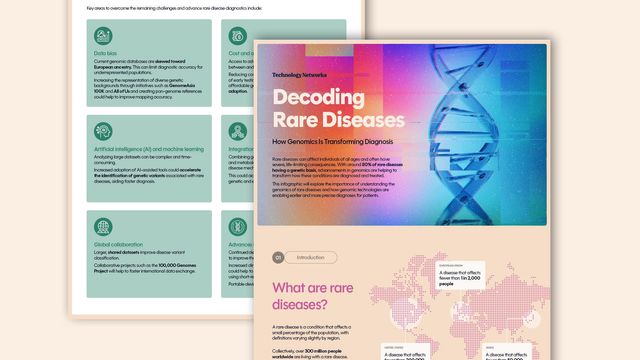
Decoding Rare Diseases: How Genomics Is Transforming Diagnosis
This infographic explores how genomic technologies are enabling earlier and more precise diagnoses for patients.

Infographic
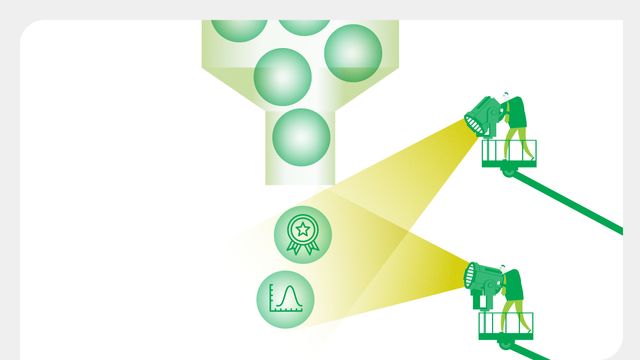
Choose the Right Reaction Chemistry for Real-Time PCR
This infographic explores key differences to help researchers determine the most suitable approach for their experimental workflows.
Infographic
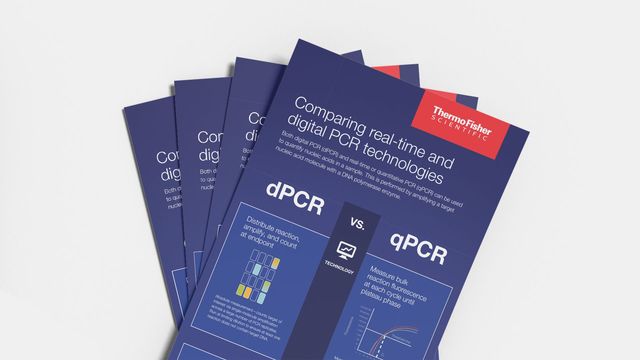
How To Choose Between Real-Time and Digital PCR Technologies
This infographic breaks down the technology behind each technique, as well as their workflows, applications and important the benefits of each approach.
Infographic
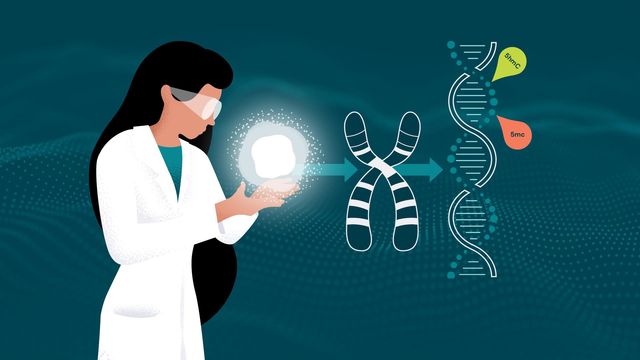
Reveal the Power of the 6-Base Genome
This infographic explores how this "6-base genome" approach helps researchers better understand gene expression and disease mechanisms by integrating epigenetic markers with genetic data.
Infographic
Experience the Picus® 2 Difference
How Picus® 2 Benefits Your Pipetting
Advertisement