Cancer treatment strategies remain imperfect despite years of extensive research, largely due to the complexity of the tumor microenvironment (TME).
Spatial transcriptomic technologies can provide crucial insights into the interplay of different cellular and acellular components that orchestrate tumor progression, angiogenesis, immune evasion and metastasis.
This poster highlights the importance of exploring the spatial organization of the entire transcriptome in cancer tissues and presents a powerful platform for unraveling the complexities of the TME.
Download this poster to discover:
- A novel assay for unbiased spatial gene expression profiling of fresh frozen tissue
- Precise profiling of finer anatomical features with high tissue coverage at single-cell scale resolution
- Case studies demonstrating TME profiling in various cancer tissues
Visium HD 3’ enables unbiased whole transcriptome spatial profiling of Tumor
microenvironment in fresh frozen cancer tissues at single cell scale resolution.
Debashish Chitnis1, Marco Serra1, Josh Gu1, Anushka Gupta1, Nancy Conejo1, Aarushi Kalaimani1, Miriam Valencia1, Monica Nagendran1,
Zixue Ma1, Govinda Kamath1, Joey Arthur1, Julia Cowen1, Anuj Patel1, David Sukovich1, Augusto M Tentori1 10x Genomics, Pleasanton, CA
3. Tissue microenvironment profile highlights tumor-stroma interaction in human breast cancer
Please contact info@10xgenomics.com for inquiries or learn more at 10xgenomics.com
References and Acknowledgments
1. Ali, A., Brown, V., Denley, S., Jamieson, N. B., Morton, J. P., Nixon, C., Oien, K. A. (2014). Expression of KOC, S100P, mesothelin
and MUC1 in pancreatico-biliary adenocarcinomas: development and utility of a potential diagnostic immunohistochemistry panel.
https://pmc.ncbi.nlm.nih.gov/articles/PMC4112611/?utm_source=chatgpt.com
2. Miyako, Shoji, et al. “Periostin in Cancer-Associated Fibroblasts Promotes Esophageal Squamous Cell Carcinoma Progression
by Enhancing Cancer and Stromal Cell Migration.” The American Journal of Pathology, vol. 194, no. 5, May 2024, pp. 828–848,
https://doi.org/10.1016/j.ajpath.2023.12.010.
3. Li, Q., Chu, Y., Li, S., Yu, L., Deng, H., Liao, C., … Huang, L. (2022). The oncoprotein MUC1 facilitates breast cancer progression
by promoting Pink1-dependent mitophagy via ATAD3A destabilization. https://www.nature.com/articles/s41419-022-05345-z
4. Wang, F., Kohan, A. B., Lo, C.-M., Liu, M., Howles, P., & Tso, P. (n.d.). Apolipoprotein A-IV: a protein intimately involved in
metabolism. https://pmc.ncbi.nlm.nih.gov/articles/PMC4513983/
5. Tokuhara D;Nochi T;Matsumura A;Mejima M;Takahashi Y;Kurokawa S;Kiyono H;Yuki Y; (n.d.). Specific expression of
apolipoprotein A-IV in the follicle-associated epithelium of the small intestine. https://pubmed.ncbi.nlm.nih.gov/24838500/
6. Sitapriya Moorthi., Alice H. Berger., All About That Ras: Novel Fusion Drives Ras Pathway Activation in Lung Cancer.Clin Cancer
Res (2022) 28 (14): 2983–2985. https://doi.org/10.1158/1078-0432.CCR-22-0736.
7. Lin, J., Huang, G., Zeng, Q., Zhang, R., Lin, Y., Li, Y., … Pan, H. (2024). IGFBP5, as a Prognostic Indicator Promotes Tumor
Progression and Correlates with Immune Microenvironment in Glioma. https://pmc.ncbi.nlm.nih.gov/articles/PMC10751672/
8. Dongfeng Sun, Jie Lu, Hui Tian, Hao Li, Xiaozheng Chen, Feng Hua, Wenfeng Yang, Jinming Yu, Dawei Chen, The impact of
POSTN on tumor cell behavior and the tumor microenvironment in lung adenocarcinoma,International Immunopharmacology,
Volume 145, 2025, 113713, ISSN 1567-5769, https://doi.org/10.1016/j.intimp.2024.113713.
9. Zhu, R., Huang, J., & Qian, F. (2025). The role of tumor-associated macrophages in lung cancer. Retrieved from
https://pmc.ncbi.nlm.nih.gov/articles/PMC11897577/
10. Duan, Z., & Luo, Y. (2021). Targeting macrophages in cancer immunotherapy. Retrieved from
https://www.nature.com/articles/s41392-021-00506-6
Thanks to the Visium HD development team at 10x Genomics, Pleasanton, CA. (Histology team, Microscopy and Sequencing Core)
#5301
1. Introduction
Despite years of studies and effort, the best strategies for treating
cancer and minimizing the complications of treatment remain
unanswered questions. This gap in knowledge is partially due to the
inability to dissect the complex heterogeneous tumor
microenvironment (TME) and Stromal/immune compartment. Spatial
transcriptomic technologies investigate the complexity of the tumor
microenvironment, providing crucial insights into the interplay of
different cellular and acellular components that orchestrate the tumor
progression, angiogenesis, immune evasion, and metastasis.
2. Methods
We introduce Visium HD 3’, a novel assay for unbiased spatial gene
expression profiling of fresh frozen tissue sections mounted on a
standard glass slide. The Visium HD’s array has a gapless design that
enables integration of unsupervised gene expression clustering data
with microscope H&E images from the same tissue section, allowing
precise profiling of finer anatomical features with high tissue coverage
at single cell-scale resolution. Furthermore, this novel reverse
transcription-based assay generates cDNA products compatible with
both short reads and long reads sequencing, extending its
applications beyond gene expression analysis to enable immune
profiling and the discovery of isoforms and novel transcripts on a
spatial level unlocking deeper insights into cancer diversity.
Figure 1. Visium HD Spatial Gene Expression slide. The Visium HD Slide Capture
Area consists of ~11 million 2 x 2 μm spatially-barcoded squares without gaps and the
data was binned to 8 x 8 μm for visualization and analysis. Visium HD data is also
available with the raw 2 μm data and other bin sizes.
Figure 2. Visium HD 3’ assay workflow. Visium HD 3’ is compatible with H&E staining
of fresh frozen (FF) tissues mounted on glass slides using routine histological
workflows. This provides the flexibility to image and select target regions prior to whole
transcriptome analysis. The Visium HD 3’ assay utilizes the CytAssist instrument for
transcript capture. The captured transcript undergoes reverse transcription, second
strand synthesis and finally cDNA amplification. This is followed by library construction,
sequencing, data processing with Space Ranger, and visualization with Loupe Browser.
Figure 3. (A) Unbiased gene expression based clustering (8μm bin) identifies key clusters differentiating the
tumor and stromal environment in human breast cancer. Differential expression of the tumor and stromal cluster
identifies spatial markers such as EPCAM, ERBB2, AR, MUC1 known to be overexpressed in breast cancers(3)
and POSTN, ACTA2, LUM, MMP2, SFRP4 involved in modulating tumor-stroma interaction, extracellular matrix
remodelling and immune evasion.(2) (D) Co-expression of these marker genes highlight the boundaries
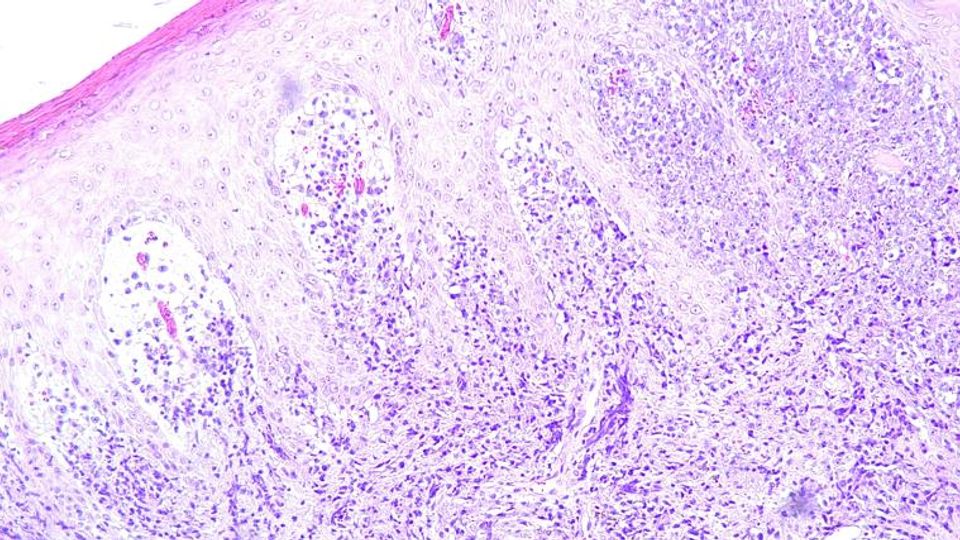
between tumor and stromal layers. (B) Annotation by pathologist of H&E stained image confirms the invasive
carcinoma as identified with the unbiased clustering. (C) In addition, clustering based on nuclei based cell
segmentation is further able to resolve the stromal compartment. Looking into the differentially expressed
genes in these clusters manual cell type annotation was performed identifying tumor, endothelial, tumor
associated macrophages (TAM), fibroblasts, mesenchymal and epithelial cell types.
4. Unbiased clustering and tissue-specific
marker gene expression identifies small intestine
remnant in pancreatic cancer tissue
5mm
2mm
Tumor cells
Endothelial cells
TAM (Tumor
Associated Macrophages)
Fibroblasts
Mesenchymal cells
Epithelial cells
2mm
500μm
Tumor
EPCAM
ERBB2
AR
MUC1
Stroma
POSTN
KRT7
ACTA2
LUM
MMP2
SFRP4
Spatial marker co-expression
2mm 500μm
5mm Tumor Organ: Ampulla of Vater
Tumor Grade: Well Differentiated
Immune Aggregate
Small Intestine
Invasive Carcinoma
Figure 4. (A) Unbiased clustering (8μm bin) identifies two clusters pertaining to
morphologically distinct spatial regions. (B) Co-expression of tissue specific markers such as
Muc1, s100P(1) for pancreatic cancer and APOA4, APOA1, REG3A, ALDOB known to be
expressed in the enterocytes in villi of small intestine and involved in lipid and energy
metabolism.(4,5) (C) Annotation by pathologist of H&E stained image and anatomy of the
tissues indicate that a portion of the small intestine was removed along with the pancreas
while performing the tumor biopsy. This is fairly common when tumors form in the head of
the pancreas, which connects to the duodenum region of the intestine.
A. C.
D.
A.
5mm
B.
C.
Small Intestine and Pancreas Anatomy
Small Intestine Markers APOA4, APOA1, REG3A, ALDOB
Pancreatic Cancer Markers Muc1, s100P
6. Deeper dive into the tumor microenvironment of
human lung adenocarcinoma
2 mm 500μm
A.
2mm
Tumor cells
EIF3L
MAL2
RPSA
OCLN
MUC1
M2 TAMs
SPP1
FOLR2
CD163
CCL13
Figure 6. (A) Unbiased nuclei based cell segmentation based clustering identifies key
clusters. We annotate four cell types (tumor associated macrophages, tumor cells, plasma/B
cells, fibroblasts) based on differential marker gene analysis. (B) M2 TAM’s or pro-tumorigenic
macrophage identified based on CCLl13, SPP1, CD163, FOLR2.(6,7) Co-expression of tumor
cell markers and M2 TAM’s is indicative of tumor progression, metastasis and immune invasion
in lung adenocarcinoma. (C) IGFBP5, POSTN, and COL3A1 are integral to fibroblast activation
in the tumor microenvironment of lung cancer.(8) The interaction between these genes and the
tumor cells in the stromal component is in line with identification of M2 TAMs. These factors point
to fibroblast-to-Cancer associated fibroblast conversion in the extracellular matrix (ECM).(9)
(D) Plasma/B cell cluster are identified with expression of the IG genes. B-cells in the TME can
activate TAMs via cytokine signaling promoting M2 polarization of macrophages.(10)
5. Tumor-stroma-immune interactions in
pancreatic cancer tumor-microenvironment.
A.
Figure 5. (A) Unbiased gene expression (8μm bin) based clustering identifies
key immune, stroma,tumor associated clusters. Spatial markers were identified by
differential gene expression analysis. We use these key gene markers to show
co-expression of invasive carcinoma with (B) immune aggregates, (C)
B-cells/Plasma and (D) Stroma/Fibroblasts. This is also inline with the annotation
by pathologist - Fig 4. (c)
B.
Cancer
activated
Fibroblasts
(CAF)
IGFBP5
POSTN
COL3A1
2mm 500μm
2mm 500μm
Plasma/B cells
IGKC
IGHG3/4
IGHA1/2
IGLC2
JCHAIN
C.
D.
B. C.
5mm
1mm
1mm
D.
Stroma/Fibroblasts
ISLR
MMP11
COL3A1
1mm
B-cell/Plasma
IGLC3
IGHG3
IGHG4
B.
1mm
Invasive
carcinoma
Muc1
s100P
Immune
aggregate
CD48/52/79A
MS4A1
CR2
CXCR4
Abstract Presentation Number
2mm 500μm
9. Conclusion
Our study highlights the importance of exploring the spatial organization of
the entire transcriptome in cancer tissues and demonstrates that Visium HD
3’ platform is a powerful tool for unraveling the complexities of the tumor
microenvironment. These findings may assist with the development of
innovative therapeutic strategies and precision medicine approaches,
ultimately contributing to improve outcomes for cancer patients.
Tumor cells
Plasma/B cells
Fibroblasts
TAM (Tumor
associated
macrophages)
500μm
© 2025 10x Genomics, Inc. FOR RESEARCH USE ONLY. NOT FOR USE IN DIAGNOSTIC PROCEDURES.